When it comes to promoting your own businesses or affiliate offers online, it’s important to make sure that you are getting the value for your ad spend. But how exactly do you know if your marketing campaigns are working?
It’s actually a two-step process. First, you must identify your Key Performance Indicators (KPI) for your advertising strategy. Next, you have to establish the benchmark for each KPI so you can effectively gauge if your marketing campaigns are performing above or below your expectations.
When it comes to Native Advertising, one KPI that you should never overlook is Click Thru Rate or CTR for short. But what exactly is CTR and how would you know if your ad is performing well based on this metric?

CTR Defined
Click-Through Rate is simply the percentage of users who clicked on your ad, as opposed to those who saw it. For instance, if there are 100 people who viewed your ad and only seven of them clicked on it, then your CTR is 7%.
This metric is important for marketers that use native ads because it helps them understand how effective their ad headline and image are when it comes to (1) catching the user’s attention, and (2) making them interested enough to click. You would of course have to compare your ad campaigns’ CTR against the Cost Per Click and the Conversion Rate to determine their effectiveness, but those are topics for a different time.
What Makes for a Really Good CTR for Native Ads?
It would be hard to assess your ads’ performance if you have no data to compare it against. One good benchmark is the industry average. Don’t forget that average CTR varies based on the ad format, the platform, and the niche. However, to help you get started, here are some statistics that you can use as a basis:
- Ad Format and Device
According to Gourmet Ads, the CTR of traditional banner ads as of 2019 is 0.11%. On the other hand, native ads receive an average CTR of 0.16% on desktop, and a whopping 0.38% on mobile.
- Global versus Local
Based on a report prepared by Polar Inc., the CTR of branded content on a global scale is 0.25% in 2017, which increased to 0.29% in 2018. In the United States alone, the average click-through rate of native ads is 0.36%, which is the highest worldwide.
- Single Versus Multiple Ad Variations
From the same report, it was found that the average CTR of campaigns that use only one heading and image combination is 0.20%. However, those using multiple ad variations were able to achieve a record-high CTR of 0.75%. This supports the strategy of crafting multiple ad creatives to find the best performing combination before actually settling on one.
- Various Niches
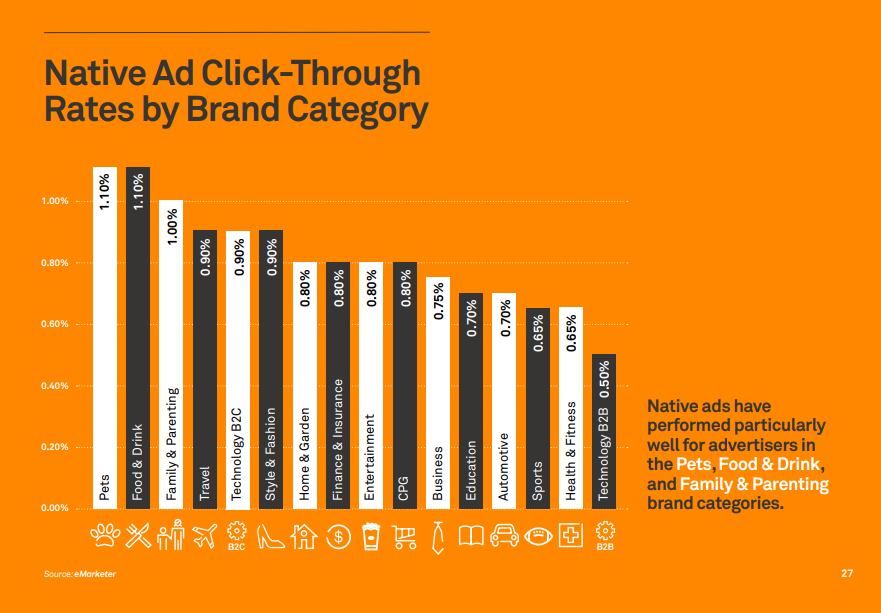
If you’re looking for niche benchmarks for native ads, one good resource is AppNexus’ 2018 whitepaper entitled “The Digital Advertising Stats You Need”. The top-performing niches based on CTR are the following (average CTR are indicated):
- Food & Drink - 1.10%
- Pets - also 1.10%
- Family & Parenting- 1.00%
- Travel - 0.90%
- Technology - 0.90%
- Style & Fashion 0.90%
Final Thoughts
Based on the information above, we can conclude that:
- Native ads perform better than banner/display ads;
- Mobile outperforms desktop, but there is still an opportunity to be explored with desktop ads;
- Creating ad variations is a must.
If your native ad campaigns are experiencing really low CTR, it might be time to test different creatives. Keep in mind, though, that the click-through rate is not the only thing you should look into when it comes to determining how effective your ads are.
To make it easier for you to monitor and compare your ads’ CTR performance across multiple native ad platforms, it would be best to use a tool that allows you to manage all these traffic sources in one dashboard. Brax can help you in this aspect. Test our platform for 15-days and see how beneficial it is to access everything under one roof.

