For any marketer or business owner utilizing native advertising, understanding the performance of your campaigns is non-negotiable. If you find yourself consistently losing your ad budget without seeing a significant return on investment, it may be time to reconsider your approach.

Tracking campaign performance is not just about keeping an eye on your spending; it's about ensuring that every dollar you invest is working effectively to generate meaningful results.
Without proper tracking, you run the risk of pouring your resources into strategies that may be underperforming or completely ineffective.
By implementing effective tracking measures, you can identify what's working in your campaigns, what isn't, and where there's room for improvement to optimize your ad spend.
What exactly are the main steps to follow when tracking native advertising performance? Let's talk about them.
#1: Setting Clear Campaign Objectives
Before launching into the vast ocean of native advertising, one must not forget the compass — setting clear campaign objectives. This isn't just a preliminary box to tick, but rather a beacon that guides your campaign before and during its execution. Having a well-defined objective is paramount to running native ads successfully.

Knowing your end goals — whether that's increasing brand awareness, boosting website traffic, or driving sales — will provide you with the metrics needed to track your campaign's success.
It's like a road map that not only shows you the destination but also the steps required to get there.
Only with these objectives clearly outlined can you accurately measure your success and ensure your ad spend is yielding the returns you desire.
To do that, you must establish SMART goals for your campaigns. These are specific, measurable, achievable, relevant, and time-bound objectives.
Examples of SMART Goals for Native Ads Campaigns
Increase Brand Awareness
You may aim to increase the number of impressions by 20% over the next quarter, thus raising awareness of your brand among potential customers.
Boost Engagement Rates
Focus on enhancing interaction with your native ads. For instance, aim to improve the click-through rate (CTR) by 15% in the next two months.
Drive Website Traffic
Set a goal to increase traffic to your website from native ads by 30% in the next six weeks.
Increase Conversions
Aim to increase the conversion rate from native ads by 25% over the next quarter.
Improve Retention
Set a target to reduce the bounce rate from your landing page linked to your native ads by 10% within the next two months.
Always analyze your campaign performance against these goals to ensure your advertising efforts are on track.
#2: Identify KPIs
Once your SMART goals are in place, identify your key performance indicators (KPIs). These are the metrics that align with your campaign objectives. They help you gauge the effectiveness of your native ads.
The goals are what you want to achieve for your business, and the KPIs are the indicators of whether these goals are being achieved.
For instance, if the goal is to gain more subscribers at a lower price, the KPI is the number of leads and the cost per lead (CPL).
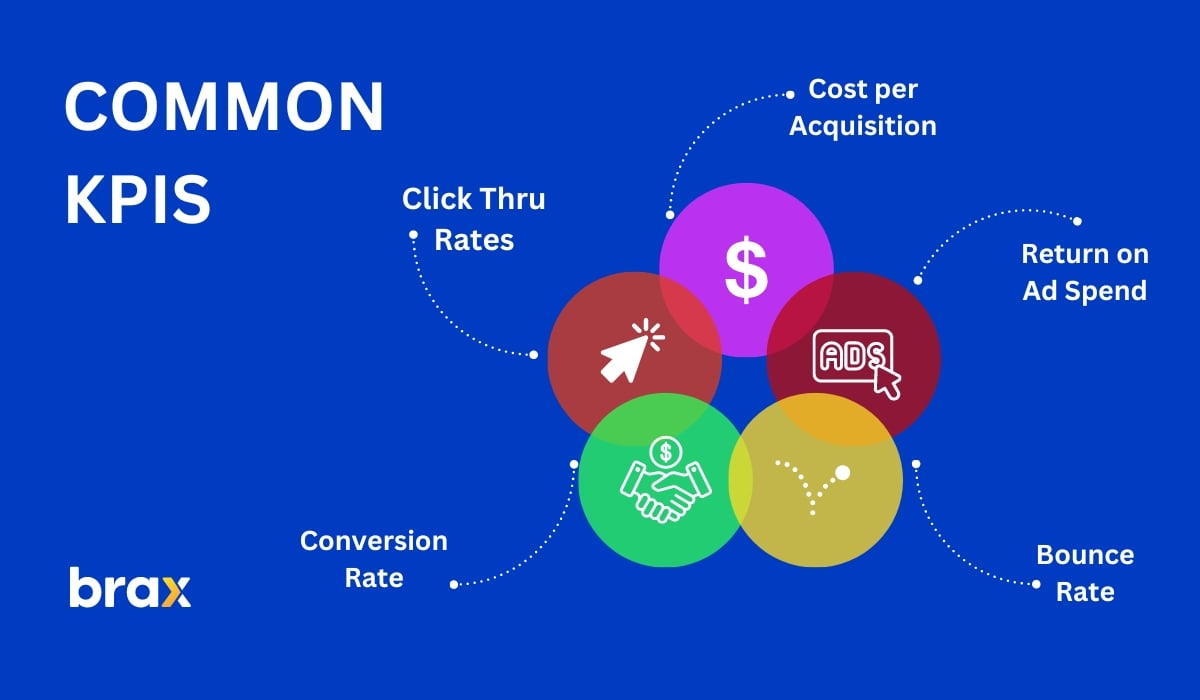
Here is a list of possible KPIs you can use:
Click-Thru Rate (CTR)
The CTR is the percentage of users who clicked on your ad out of the total number of people who were exposed to it. This metric measures how appealing your native ads are to your target audience. Generally, a higher CTR indicates that your ad is relevant and engaging to users.
Conversion Rate
This is a critical KPI in any advertising campaign.
It represents the percentage of users who take a desired action after viewing your native ads. The action could be anything ranging from making a purchase, signing up for a newsletter, downloading an ebook, or any other action that aligns with your campaign objectives.
A higher conversion rate indicates that your native ads are effective in persuading users to complete the intended action.
It's calculated by dividing the number of conversions by the total number of ad interactions and then multiplying the result by 100.
Cost Per Acquisition (CPA)
CPA is the average cost you incur to acquire a customer through your native ads. It's calculated by dividing the total cost of your campaign by the number of conversions.
This KPI helps you understand how much it costs to convert a user into a customer, and if it aligns with your budget and business goals.
It can also be Cost per Lead (CPL), Cost per Sale (CPS), or Cost per Install (CPI). It all depends on the kind of conversion you expect.
Return On Ad Spend (ROAS)
ROAS measures the return on investment (ROI) of your native ads by comparing it to the amount spent on advertising. It's calculated by dividing the total revenue generated from your native ads by the cost of those ads.
Bounce Rate
This KPI measures how many users leave your website after viewing your landing page through a native ad without taking any action or exploring further. A high bounce rate can indicate that your landing page is not optimized or relevant to the ad, and may need improvement.
These metrics are usually available in third-party analytics platforms. If yours doesn't have one by default, look into creating custom KPIs.
#3. Leverage Analytics Tools for Enhanced Insight
To extract the maximum value from your native advertising campaigns, it's essential to employ robust analytics tools.
While native advertising networks do provide basic reporting mechanisms, they often fall short when it comes to offering the comprehensive insights necessary for optimizing campaign performance.
Utilizing advanced third-party analytics tools fills this gap, allowing you to delve deeper into your campaign data. Here's how it does that:
- It Provides Granular Data
Analytics tools enable you to dissect every aspect of your campaign, from click-through rates to conversion rates, providing a granular view of your performance. They make it possible to identify trends, patterns, and areas of concern that may not be immediately visible through standard reports.

For instance, an analytics tool can reveal the specific time of the day when user engagement is the highest. Armed with this information, you can schedule your native ads optimally.
Similarly, it can identify geographic regions or cities where your ads perform exceptionally well, facilitating geo-targeted campaigns.
- It Allows A/B Testing for Optimization
One key feature of analytics tools is their ability to facilitate A/B testing of ad elements, such as headlines, images, and call-to-action buttons.
A/B testing is a method where you compare two versions of an ad to see which performs better.

For example, let's consider the testing of headlines. You might have two different headlines for the same ad — one straightforward and factual, the other emotional and thought-provoking.
The advertising network would display these versions separately while your analytics tool tracks each ad's performance. This is commonly measured through KPIs like CTR and engagement rate.
The same principle applies to images. You could test a vibrant, colorful image against a minimalist, black-and-white one. Or compare a call-to-action that uses urgent, persuasive language against a more laid-back, suggestive phrasing.
The data from these tests is then analyzed to identify any significant variations in performance.
For instance, you might find that a particular headline leads to a higher CTR, or that users are more likely to engage with a specific image.
There are other things to test, too, not just the ads itself. You can test your targeting and even multiple native advertising networks to see which of them delivers the best results.
Want to learn more about A/B Testing for Native Ads? We've prepared in-depth guides for you, check them out here: A/B Testing for Native Ads: Finding the Perfect Ad (Part 1) and Part 2.
- It Delivers Real-time Monitoring
Real-time monitoring is another significant advantage offered by these analytics tools. They provide instant reports on how your native ads are performing at any given moment, giving you the ability to respond swiftly to any changes in user interaction.

If an ad isn't performing as expected, being able to see them in real-time allows you to identify this issue immediately and make necessary adjustments to optimize your campaign. You can tweak the ad content, adjust the targeting parameters, or modify the bidding strategy based on live data.
This level of flexibility and control is crucial in the dynamic digital advertising landscape, where every click matters and delayed responses can lead to missed opportunities.
- It Offers Automation and Custom Reporting
Advanced analytics tools streamline your workflow with their automation capabilities. They remove the need for manual data collection and interpretation.
The tools automatically generate insightful reports, saving you time and effort. The latest data is always right at your fingertips. Some reporting tools even let you set up email notifications, so you can view the status of your campaigns even when you're on the go.
This empowers you to make informed decisions quickly and easily.
One such tool is Brax.
Brax is more than just an analytics tool. It's also a native advertising tool that provides full automation. Brax's functions extend beyond conventional reporting.
It automates ad creation, management, and optimization, leaving you free to focus on other important aspects of your campaign. It helps you maximize your advertising efforts and achieve better results.
One example of automation that Brax can do is ad campaign creation. With its Power Editor, you can create a campaign with a hundred different ad variations in a matter of minutes! Yes, what can take you hours to do manually in your native ads platform can be done in a few simple steps.
Here's a quick guide on how to do Bulk Uploads using the Power Editor.
Another time and effort-intensive task is optimization. Imagine having dozens or even hundreds of campaigns that you need to analyze and optimize every single day! It will surely make you dizzy, and you might even make an optimization mistake!
To avoid such incidents, you can use Brax's Rules-Based Optimization.
Rules-Based Optimization in Brax is an advanced feature that allows you to set specific conditions for your native ad campaigns. When these conditions are met, Brax will automatically make adjustments to your campaign for optimal performance.
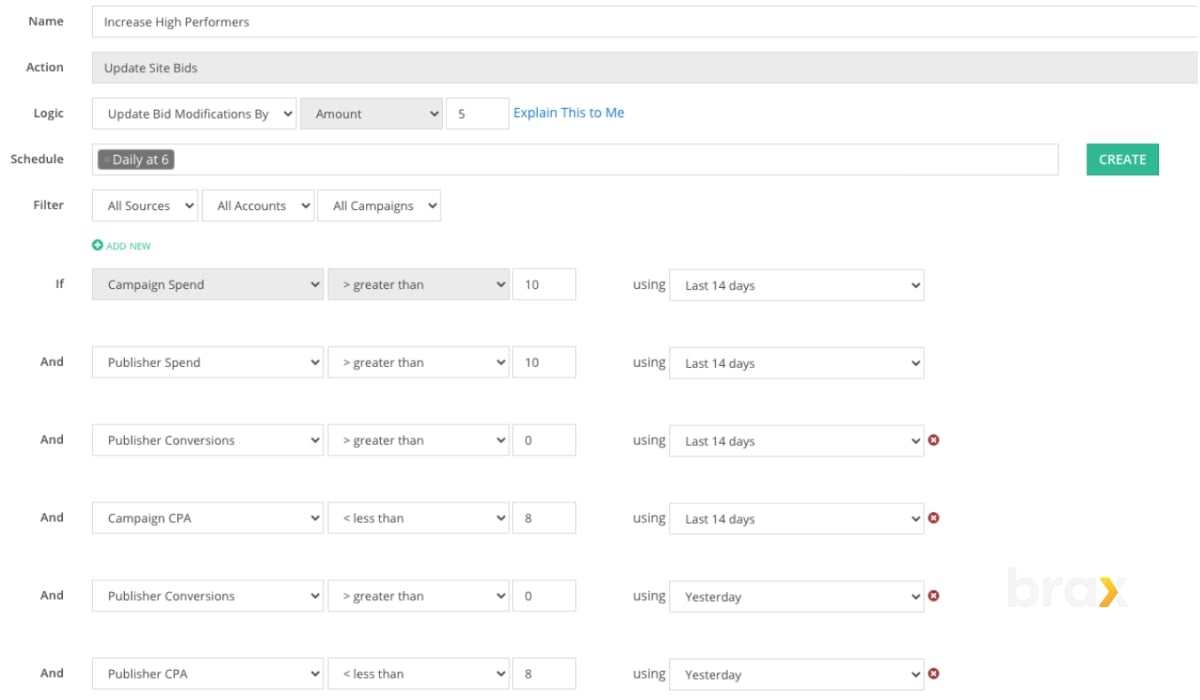
This could include actions like pausing underperforming ads, adjusting bids, or reallocating the budget based on your predefined rules. This automated optimization process saves you time, reduces human error, and ensures your campaigns are always performing at their best.
Read our Step-by-Step Guide to Brax Rules for more information on how this can be done. While the article focuses on E-commerce and Content Publishers, it will still provide you with everything you need, no matter what industry you are in. For as long as you are running native ads, you can use Brax's optimization automation.
Brax is a complete tool that caters to all your native advertising needs. It is efficient, reliable, and user-friendly. It's the smart choice for businesses looking to maximize their ad campaign performance.
Click here to book a demo and see how the tool works for yourself! Or, you can sign up for a 14-day free trial.
In essence, if you're committed to maximizing the return on your native advertising spend, incorporating a powerful analytics tool into your strategy is not just beneficial — it's crucial.
The enhanced understanding of your campaign performance provided by these tools can be the difference between an average native ad campaign and a highly successful one.
#4. Compare Your Performance with Industry Standards
In addition to assessing your native ads' performance against past data, it's crucial to understand how you're stacking up against your competitors.
A simple yet effective method to gauge this is by examining industry standards. By doing so, you gain a better understanding of the competitive landscape and can set realistic and achievable benchmarks for your campaign.

Industry standards provide a bar for ad performance across different sectors. They reflect the average or typical performance you can expect based on historical data from a wide range of campaigns within your industry.
If you're exceeding the standards, it's a sign that your campaign is doing well. However, if you're falling short, it's a signal that you may need to take a closer look at your ads and identify areas for improvement.
To obtain industry standards data, you can look at studies and reports published by advertising platforms, marketing research firms, and industry associations.
These resources provide a wealth of information on average CTRs, conversion rates, cost-per-click (CPC), and other key performance indicators (KPIs) across various industry sectors and markets.
Taboola often publishes benchmark reports on different industries, allowing you to compare your campaign performance with other industry-wide advertisers.
Here's an example of an industry benchmark by Taboola for the Technology industry.
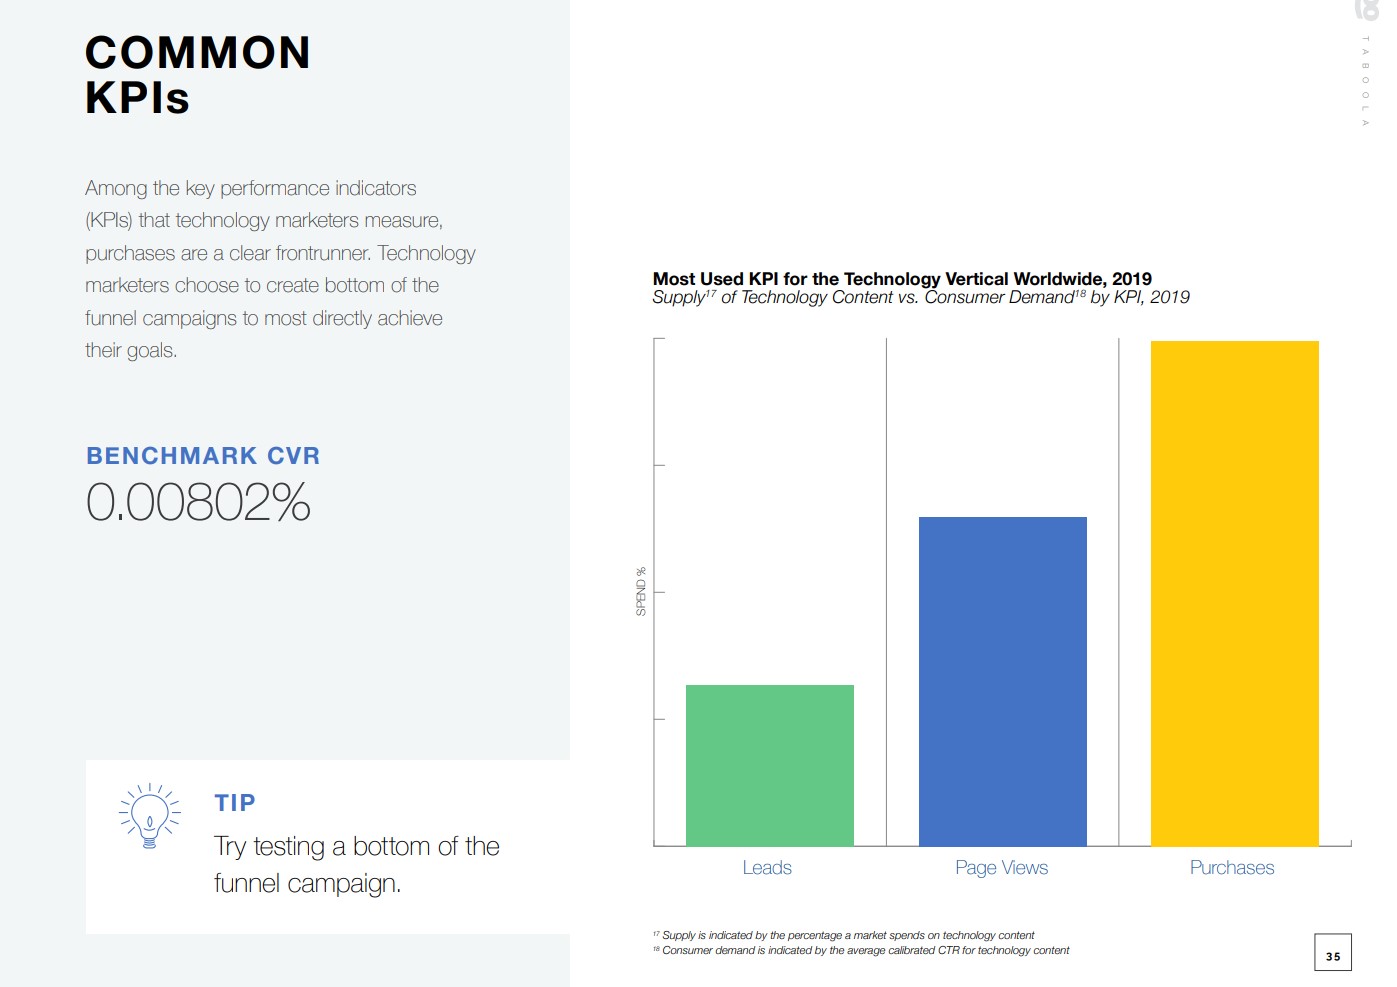
However, it's important to keep in mind that these are averages, not absolute figures.
Factors such as your specific product or service, your target audience, and your geographic location can significantly impact your ads' performance.
So, while industry standards can guide your strategy, they should not dictate your goals completely.
It is essentially competitor analysis, except you are comparing yourself with the industry as a whole. Also, comparing yourself industry-wide is essential since it's highly unlikely that you can get your hands on competitor data, right? (If you can, then even better!)
Taking the time to analyze your performance against industry standards is a step towards making informed, data-driven decisions. It empowers you to identify gaps, design better strategies, and ultimately drive more impactful advertising campaigns.
Stepping beyond your own data and understanding your standing within the wider industry context can prove invaluable in achieving advertising success.
Wrapping Up
Properly tracking your native ads' performance involves a strategic blend of setting clear, measurable goals, identifying relevant KPIs, leveraging analytics to its full potential, and benchmarking your performance against industry standards.
This combination of strategies places you in the driver's seat of your ad campaign, equipping you with the insights needed to optimize performance, finetune your approach, and maximize your advertising return on investment.
Remember, success in native advertising lies not just in the act of placing ads, but in the art of understanding how they are doing. So keep promoting and keep monitoring!

